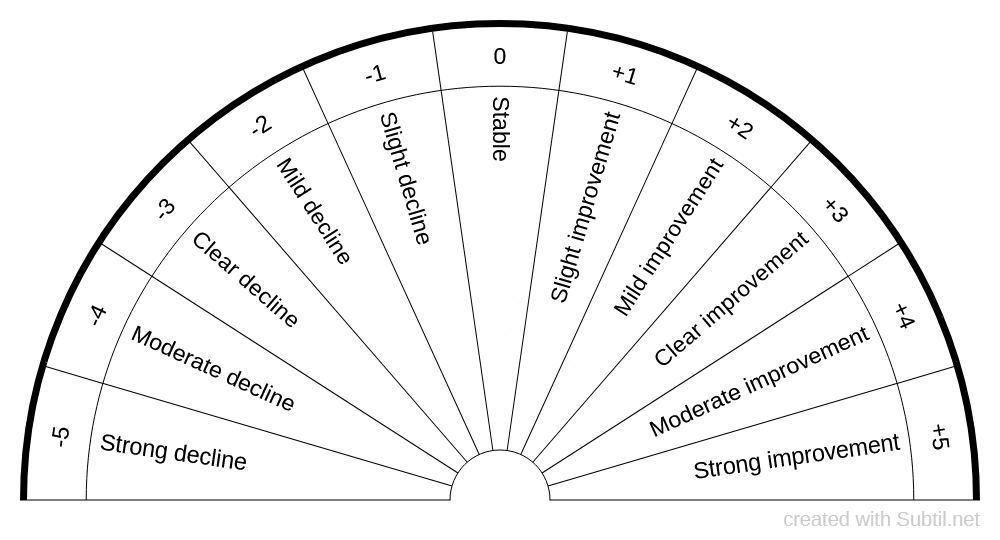
Trend-tracking chart
Classified in: Radiesthesia
Core idea: You measure movement rather than magnitude. The numbers represent relative change, not “how much energy something has.”
This keeps the system stable.
- New group 1
- -5
- -4
- -3
- -2
- -1
- 0
- +1
- +2
- +3
- +4
- +5
- Group
- Strong decline
- Moderate decline
- Clear decline
- Mild decline
- Slight decline
- Stable
- Slight improvement
- Mild improvement
- Clear improvement
- Moderate improvement
- Strong improvement
🧭 Home › Pendulum charts › Radiesthesia › Trend-tracking chart
To discover
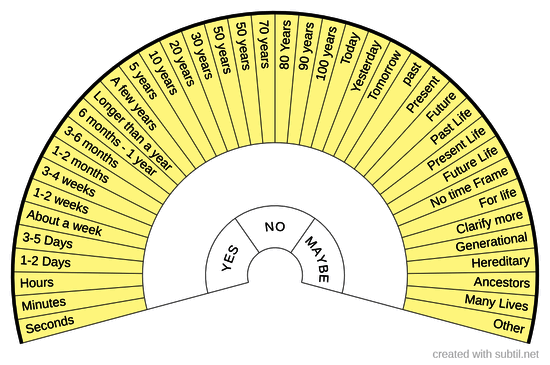
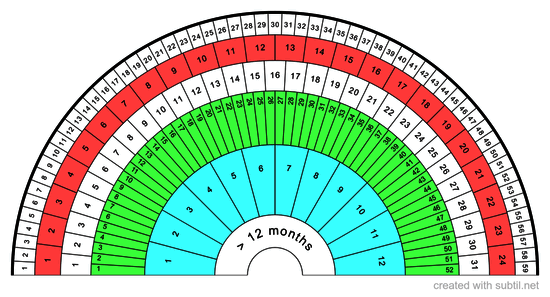
Pendulum Time Chart
Ask your guides/energy to be with you Set your intention/ask your “show me” question Hold your pendulum in your right hand over the centre of the mat Ask your question Be very watchful of your pendulum to see the way it swings The pendulum will swing towards one of the answer written on the mat Give thanks to your guides/energy Cleanse yourself and pendulum after use
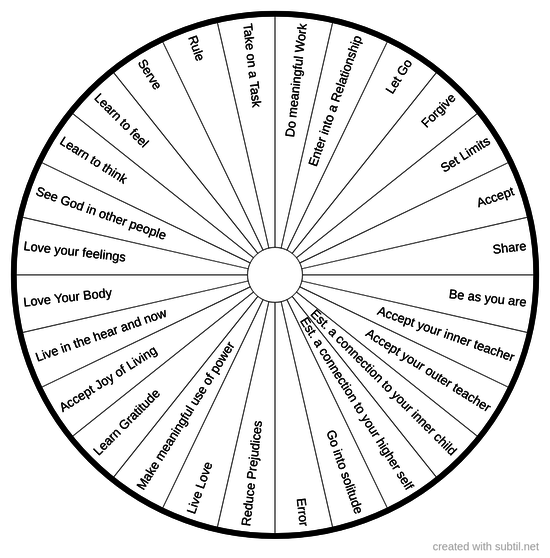
Paths
Spiritual Growth & Self Knowledge
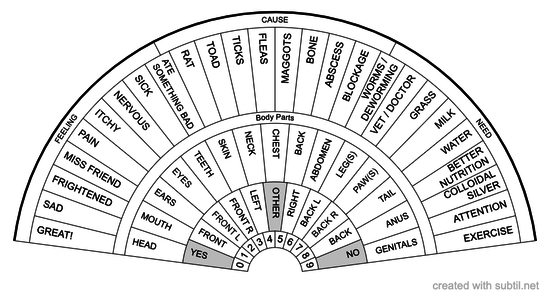
How is my pet?
More useful for dogs, and cats. For example, I've found that if my dog has eaten something bad, or had an encounter with a toxic toad/frog, a bowl of milk might help.
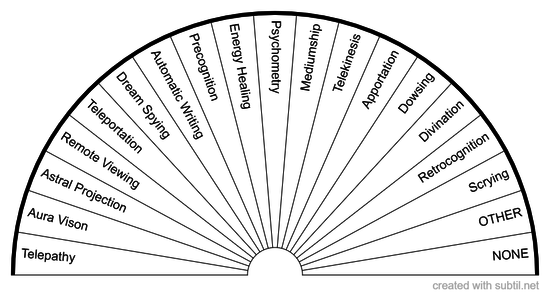
Other Psychic Abilities
More in depth psychic abilities that are related to the Psychic Claire's
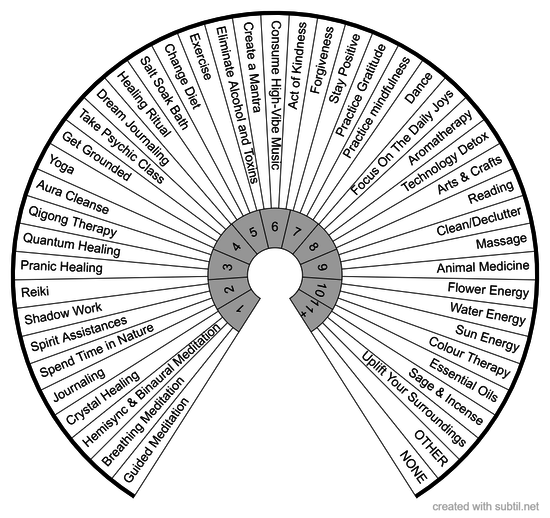
Heal, Balance & Raise Energies
Ways To Heal, Balance & Raise Energy
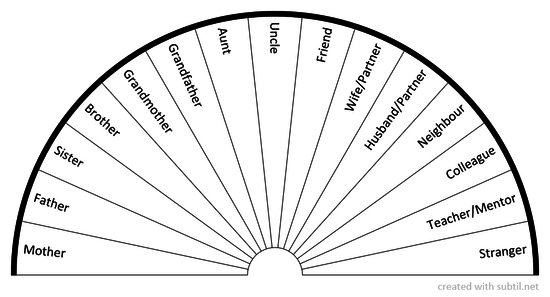
Persons
Persons in your life
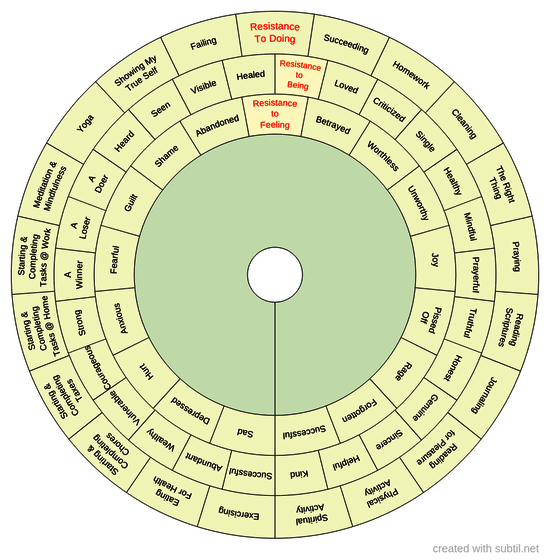
Resistance to Doing / Being / Feeling
Dowse or Muscle Test Your Resistance Levels
 offers a biometer generator and a space to share dowsing charts.
All the charts available on the site can be downloaded and printed
💙 Thanks to all users for this wonderful comm'one!